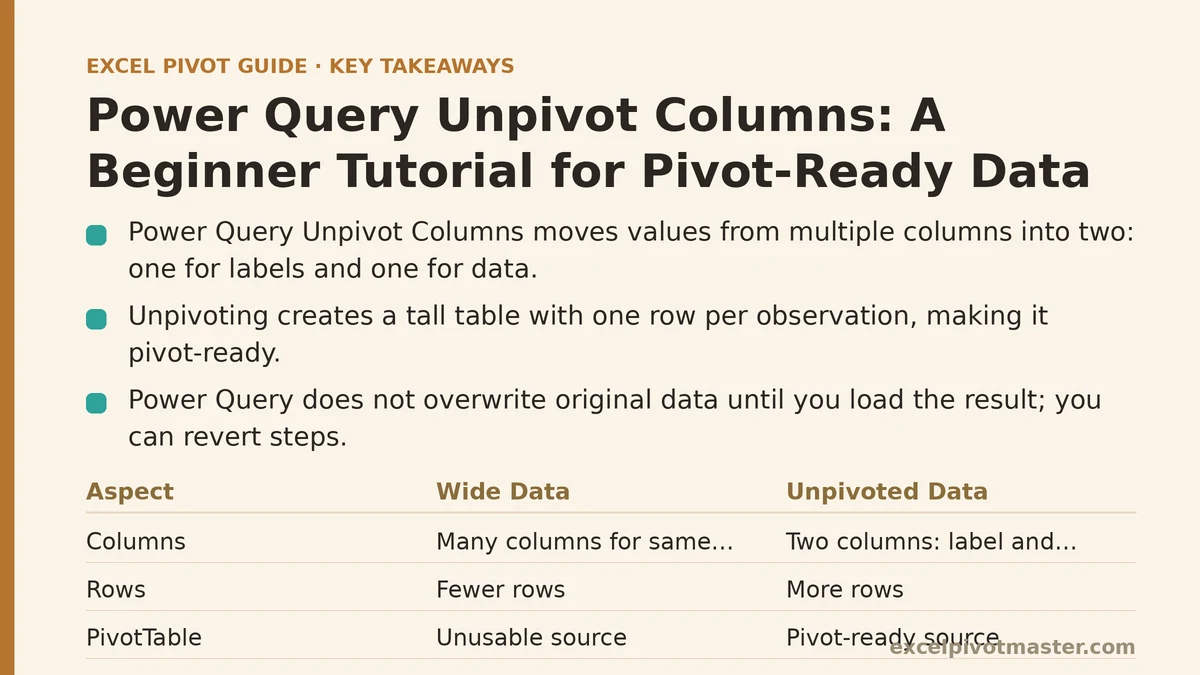
Unpivot Columns is a Power Query transformation that takes values spread across multiple columns and moves them into two columns: one holding the former column headers as labels, and one holding the former cell values as data. The result is a “tall” table where every row represents a single observation, instead of a “wide” table where the same kind of measurement is repeated sideways across the sheet.
That definition matters because most pivot table problems that look like formula problems are really layout problems. A PivotTable needs each field to live in exactly one column, with one row per record. Source data arranged as a monthly report — January through December running left to right — has no column called Month and no column called Amount. It has twelve columns that mean the same thing twelve different times. Unpivot is the transformation that collapses those twelve into the two the pivot table can read.
Why Unpivoting Matters Before You Build Anything
Consider a typical departmental report. Column A holds Region, columns B through M hold the twelve months of the year, and each cell at the intersection is that region’s sales for that month. This is a perfectly readable report for a human, and a completely unusable source for a PivotTable. If you build a pivot directly on it, you get twelve separate value fields (Jan, Feb, Mar, and so on) instead of one Sales field you can drag, filter, and group by date. Every month appears as its own column in the Values area, and the Field List becomes a wall of near-duplicate names.
A properly unpivoted version of the same data has three columns: Region, Month, and Sales. One row per region-month combination. Twelve months across three regions becomes thirty-six rows instead of three. The table is longer and narrower, and the PivotTable built on top of it behaves the way you expect — you can sum by month, group months into quarters, filter by region, and add new months to the source without touching the pivot’s structure.
The trade is real: unpivoted data takes more rows and, in a workbook with years of history, can grow large. That is a fair price for a source that behaves predictably. Most Excel files under a few hundred thousand rows handle the size without noticeable lag.
Myth: Unpivot Deletes or Rearranges Your Original Data
Reality: Unpivot adds a transformation step inside Power Query, and Power Query does not overwrite anything until you load the result.
The first time you use Unpivot, it can look like the values have been scrambled. A column called “Jan” disappears entirely, replaced by two columns whose names came from nowhere. Nothing has been lost. Power Query records each transformation as a numbered step in the Applied Steps pane on the right side of the window. You can click any earlier step to see the data exactly as it was before the unpivot, and you can delete the unpivot step with a single click. The changes only become real in your worksheet when you choose Close & Load.
If the source is a worksheet range or a Table, Power Query reads it and produces a new output table somewhere else in the workbook. The original cells are untouched. If the source is an external file or database, the original file is not modified at all. Anyone worried about “breaking” their data can proceed through the wizard and simply not load the result the first time, using the applied steps as a preview of what would happen.
Myth: You Unpivot by Selecting All the Columns You Want as Values
Reality: You select the columns to keep as labels, then choose Unpivot Other Columns.
This is the single most common mistake beginners make, and it produces a result that looks close but goes wrong the moment the source data changes. The instinct is to Ctrl-click every month column and run Unpivot Columns on them directly. That works today, for the current twelve months. Add a thirteenth column next year and the pivot misses it, because the transformation was told to unpivot “Jan through Dec” by name, and the new column has a different name.
The correct move is the inverse: select the columns that identify a row — Region, and any other fields that stay put like Product or Salesperson — then use Transform → Unpivot Columns → Unpivot Other Columns. Power Query holds the selected columns fixed and unpivots everything else, whatever it happens to be called. Add a new month to the source, refresh the query, and the new column flows through automatically.
The distinction is not cosmetic. One version survives a new column; the other silently drops it.
Myth: Unpivoted Columns Come Out With Sensible Names
Reality: The two new columns are named Attribute and Value, and you should rename them immediately.
Power Query does not know that your source columns were months or that the cell values were sales figures. It generates two generic column headers — Attribute (holding the former column names) and Value (holding the former cell contents) — and leaves the interpretation to you. Those names are functional but useless in a PivotTable’s Field List, where the field name is what appears in the row labels and column headers of the final report.
Rename them within the query, before loading. Double-click the Attribute header, type Month, press Enter. Double-click the Value header, type Sales, press Enter. The new names are baked into the query and show up automatically in the pivot table’s field list. Renaming in the query is one edit; renaming in the loaded worksheet means every refresh wipes your fix.
One related detail: if the Value column contains text mixed with numbers, Power Query may infer a text data type and leave everything as text, which breaks any sum or average later. Check the small icon in the left of the Value column header. If it shows “ABC” instead of a number symbol, click it and choose the correct type, such as Whole Number or Decimal Number.
Myth: Unpivot Is the Right Move for Every Wide Table
Reality: Unpivot is the wrong tool when the columns are not the same kind of measurement.
The technique assumes the wide columns are interchangeable variants of the same thing — Jan, Feb, Mar all represent a monthly amount. That assumption holds for time periods, for product categories, for regions listed across the top. It breaks down when the columns represent different units or different concepts.
Picture a table with columns for Revenue, Cost, Profit Margin, and Tax. These are four different quantities with different meanings. Unpivoting them into a single Value column creates a column of numbers where a $500 revenue figure sits in the same column as a 22% margin — sum that and the total is meaningless. In cases where the columns are different measures, leave them as separate fields and build the pivot on the wide layout, or split the analysis into separate queries.
A quick test: would you ever sum the values in two of the wide columns together and get a sensible total? If yes, unpivot. If no, they are different measures and unpivoting collapses information that should stay apart.
Myth: The Row Label Column Returns to Normal Once You Load
Reality: The former column headers become repeated text in the Attribute column, and you often want to keep them that way.
After unpivoting, the Region column repeats its value for every row — every region appears once per month. That repetition is not a defect to be removed with a formula; it is exactly the structure a PivotTable needs to group correctly. If you strip the repeated values and leave only the first, the pivot table can no longer tell which region each month belongs to.
What you may want to clean is cosmetic: the Attribute column often comes in as text like “Jan”, “Feb”, “Mar” sorted alphabetically, not in calendar order. Fix this by adding a Month Number column inside the query, or by leaving the labels alone and letting the PivotTable’s sort handle the order. If the column labels are real dates (2026-01, 2026-02), Power Query usually infers a date type and the pivot can group them into quarters and years directly.
Myth: Once Unpivoted, You Never Touch the Query Again
Reality: The unpivot is the beginning of a cleanup pipeline, not the end of one.
After the unpivot step, useful follow-ups include removing columns you do not need (Region ID, internal notes), filtering out blank rows in the Value column, replacing error values, and setting data types explicitly so that numbers behave as numbers. Each of these is a step in the Applied Steps pane and runs automatically every time the query refreshes.
The order matters. Set data types as the final step, after all filtering and cleanup. Applying a type earlier means the remaining steps operate on filtered and potentially altered values, and a type that was right in step 3 can become wrong by step 7. Power Query warns about this with a “Changed Type” step it inserts automatically — leave it where it is at the end unless you have a specific reason to move it.
Myth: Unpivot and Pivot Columns Are Two Sides of the Same Operation
Reality: They reverse each other structurally, but they are not interchangeable tools for cleanup.
Unpivot Columns turns wide data into tall data. Pivot Columns, the reverse operation, turns tall data into wide — it takes the values in one column and spreads them out as new column headers. You use Pivot Columns when you want a compact report layout or need to match a specific output format a downstream system expects. You use Unpivot Columns when you want a structure a PivotTable can consume.
A practical rule: build with unpivoted data, present with pivoted data. Do the unpivot inside Power Query, load the tall result, build the PivotTable on top of it, and let the PivotTable do the pivoting for presentation. Running Pivot Columns inside Power Query and then building a PivotTable on the wide result usually recreates the original problem in a new place.
Before and After: A Wide Report Next to Its Unpivoted Form
The table below shows the same three-region, three-month figure set in both layouts. The number of records triples during the unpivot, and every measurement gains an explicit label.
| Source layout (wide) | Unpivoted layout (tall) |
|---|---|
| Columns: Region, Jan, Feb, Mar | Columns: Region, Month, Sales |
| 3 rows, one per region | 9 rows, one per region-month |
| Months identified by column header | Months identified by a Month value in each row |
| New month requires a new column | New month requires only new rows |
| PivotTable needs twelve value fields | PivotTable needs one Sales field and one Month field |
| Grouping by quarter not possible | Grouping by quarter available through the Month field |
The left column is fine for reading. The right column is fine for analyzing. Unpivot moves a dataset from the first form to the second.
What to Do Next
Pick one wide report in a current workbook — the kind with month or category names running across the top — and walk it through the unpivot one step at a time:
- Load the source into Power Query. Select any cell in the range, then Data → From Table/Range. Confirm the header row and click OK.
- Select the label columns. Click the first column that identifies a row (Region, Product, Salesperson), then Ctrl-click any others that should stay fixed.
- Run Unpivot Other Columns. Go to Transform → Unpivot Columns → Unpivot Other Columns. The wide columns collapse into two.
- Rename and type the new columns. Change Attribute to a descriptive name like Month or Category, change Value to the measurement name like Sales or Amount, then set the Value column’s data type to a number.
- Remove any columns you do not need, filter out blank values, and click Close & Load.
- Build the PivotTable on the loaded output. Drag the former Attribute column to Rows, the former Value column to Values, and confirm the total matches the sum of the original wide table.
Once the query is saved, adding a new month or category to the source only requires clicking Refresh All. The unpivot already knows to include whatever new columns appear. Set up one query this way and every subsequent wide report in the workbook becomes a five-minute conversion instead of a manual restructure.
Related guides: Power Query Group By Beginner Tutorial: Summarize Data Like Pivot Tables, Pivot Table vs Power Query: When to Use Which, and Power Query vs Pivot Tables: When to Use Each (Ranked by Task).